
Ines Heating – what does heating energy reveal?
BLOG
Written by Juho Linsuri, Business Product Analyst
Properties’ ventilation time program analysis carried out by our intelligent, virtual energy and sustainability manager Ines, was the first case we made the data do the work for us. This experience proved us, that an AI takes almost no time at all to do what would normally take us hours, or even days. And in that pace, by the time you are finished with your first round you should already start the next one.
Ever wiser from the good results of the ventilation analysis, we then decided to take a closer look at heating consumption as well. We decided to divide the heating analysis into two parts. In the first part we examined the consumption energy of heating and how it’s divided between ventilation, the building base load and domestic water heating. And how these proportions vary at different times of the year, and within a week at different times of the day.
Crunching the data piece by piece
From the total heating consumption, it’s difficult to see where the changes come from and what do to for them. For this we have created a few tricks to make the analysis easier.
First, we started by dividing the consumption into three parts: domestic water heating, ventilation heating and the building base load. All this is done with automatic measurements of water and district heating using artificial intelligence, so that a separate measurement of ventilation consumption is not required.
The second trick is weather-normalized hourly energy consumption. Every energy expert is familiar with monthly normalized energy consumption, but here we have normalized every hour separately. Therefore, the hourly profile is easier to evaluate when the effect of the weather temperature variation on the consumption profile has been eliminated.
Data never lies
When you apply enough tricks, the data will not be able to lie and will confess to anything we need to know. The graphs show on the timeline if there have been any recent changes in consumption and is able to show for example, if the proportion of ventilation heating has increased or decreased.
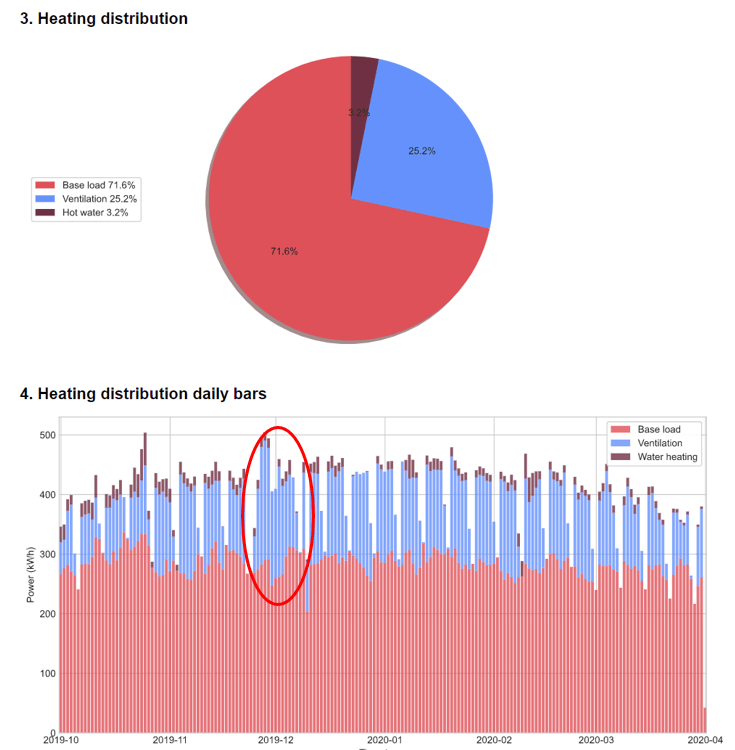
Figure 1. The share of ventilation has been high momentarily in December. Wonder if the ventilation was left on over the Christmas holidays?
From the weekly graph, you can see exactly how energy consumption is distributed within the week. You can clearly see in the graph that on weekends the ventilation is less efficient than on weekdays. The base load, on the other hand, remains at about the same level as it should be.
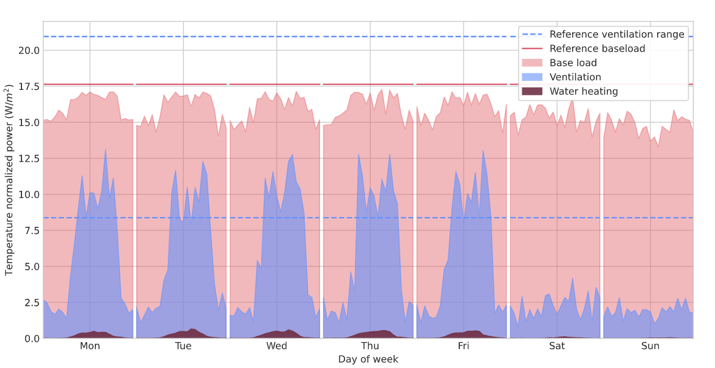
Figure 2 The weekly graph shows how consumption varies within a week.
There is no going back
With our intelligent Ines, doing tricks for data doesn’t stop there. We are kicking this year off by developing the heating analysis further. We will be for example adding the wind correlation. This will help us to tell based on the hourly normalized energy consumption the effect of the wind.
This helps to locate the targets where the insulation needs improvements and fixing that would help the energy efficiency. Insulating is one of the few structural changes that have less than 10 years payback time.
In addition, we assess the heating power demand during the biggest winter frosts and analyze the heating limit of the property. The power demand assessment is scheduled to be published as a separate package in early 2021. The processing of this package will also be continued by making for example district heating cooling analyzes that can tell the condition of district heating exchangers and control.
The heating power analysis package aims to cut peak outputs, reduce district heating water flow and improve cooling. All the above have an impact on basic district heating charges, as well as energy savings.