Smart energy and consumption management

EG Ines gives you a unique tool for digital energy and sustainability management and energy optimisation. EG Ines automatically finds the opportunities for energy saving and carbon footprint reduction with the help of artificial intelligence.


Get information about EG Ines

eg-ines

With the Forerunner package, you'll get everything in the form of EG Ines

EG Ines – Intelligent energy and sustainability manager

EG Ines Ventilation

EG Ines Ventilation

Ventilation analytics suggests right time schedules for ventilation in each facility. Ines is able to tell the occupation times from water data and the analyse ventilation on/off hours from energy data. If there is something to optimize in ventilation hours, the energy, cost and CO2-savings are calculated and visualized automatically.

Ines suggests schedules for weekdays, Saturdays, Sundays and week-day-holidays.

EG Ines Ventilationsummary.png

EG Ines Heating Consumption

EG Ines Heating Consumption

Heating consumption analytics divides the heating energy into three parts: Water heating, ventilation heating, and baseload. Ines checks if the levels of each part are on the right level compared to similar buildings. For anomalous values Ines tells the most probable reason of this and how to correct the situation. Service is going to have also wind – consumption analysis which will reveal building’s airtightness level.EG Ines Heatingdistribution.png

EG Ines Heating Power

EG Ines Heating Power

Heating power analytics analyses and benchmarks the heating setpoint of the building and the maximum power at the rated outdoor temperature. It also checks the cooling of the district heating water is at the right level at different outdoor temperatures. The water flow of district heating is analyzed and exceptions in water flow are pointed out. The electric heating in non-electric heated buildings is analyzed to discover unnecessary electric heating.

EG Ines Heatinglimitanalysis.png

EG Ines Benchmarking

EG Ines Benchmarking

Smart benchmarking compares the energy use and key-figures of energy use to similar buildings to the whole EnerKey database of over 20 000 facilities. It is easy to pinpoint from data the buildings that are not performing well compared to other similar buildings and to find out the probable causes of such behavior. Smart Benchmarking includes several analysis types depending on energy type and analyzed time of year.

EG Ines benchmarking.png

EG Ines Curve

EG Ines Curve

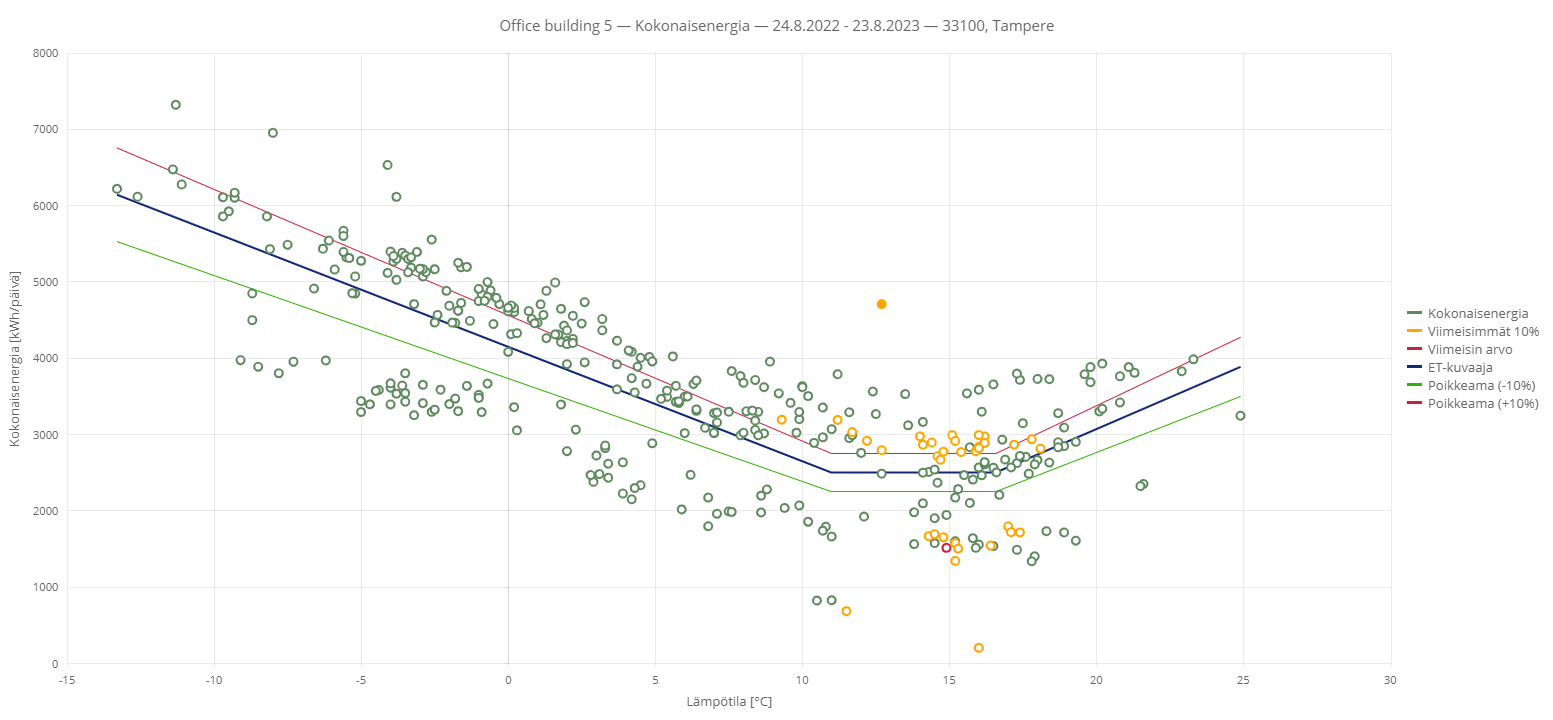
The ET-curve provides an efficient way to gain a comprehensive view of a building's consumption behavior immediately, while at the same time enabling quick interpretations. With the ET-curve, you can analyze the relationship between consumption and outdoor temperature. It allows you to pinpoint changes more accurately than by examining traditional normalized consumption.

The ET-curve forms a regression line based on data points and visualizes heating and cooling thresholds.

  • Heating thresholds - when heating starts
  • Cooling thresholds - when cooling systems kick in

The ET-curve works for both electrically heated and other heating energy targets, and you can choose your desired time interval and precision level. For electrically heated targets, you can examine this data solely based on electricity consumption data, while for other heating energy targets, you can look at the total energy consumption, which includes both electricity and heat consumption.

Especially for electrically heated targets, this is a valuable analysis tool. In electrically heated targets, heating electricity consumption is often part of the primary measurement, making its detailed analysis challenging.

imageo047a.png

Contact us

Would you like to find out more about our products and services? Contact our team of experts, and tell us about your business needs and how we can help you.

VP Sales

Jaakko Huhta

Email:  jahuh@eg.fi

Senior Sales Executive

Juha Liikanen

Email:  julii@eg.fi